Inequality of income is a relevant topic of political economics. Inequality matters for ethical reasons: as the fate of each individual affects us, the rich cannot disown the interest of the poor. And inequality can also be a source of unrest, as the poor tend to compare with the rich, rather than with the income they could have in the past (Milanovic, 2006).
In this post, I will present three measures of inequality and illustrate them by examining three income distributions with a different degree of inequality. Those distributions have been modelled to be right-skewed, as the largest values of income have been owned by few people since the beginning of history. The histograms for each distribution are:
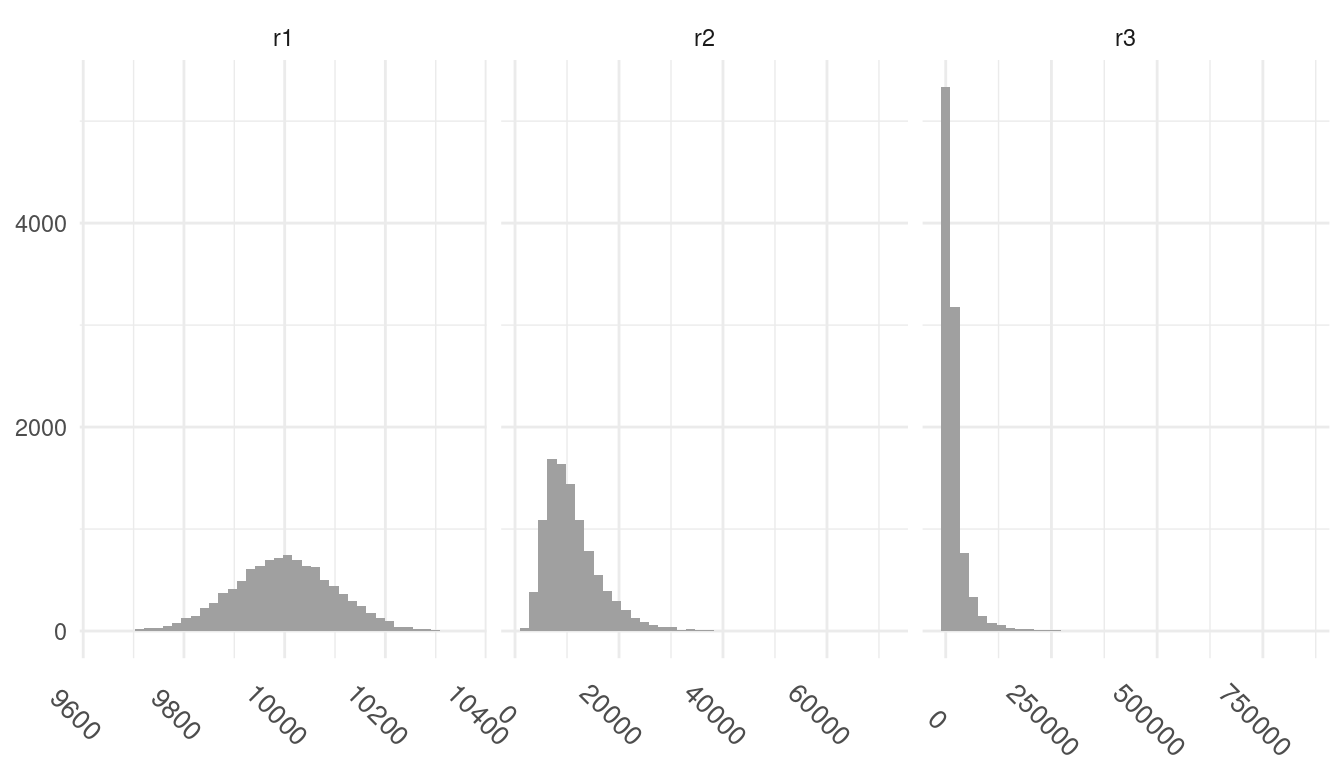
If we observe the ranges of values of income of each histogram, we can see that the first income distribution r1 is the more egalitarian, and that the third distribution r3 is the most unequal. Let’s see how can we measure inequality comparing those three distributions of income.
Mean to Median Ratio
A first measure of inequality comes from comparing mean to median. In a perfectly equal distribution the mean is equal to the median. For distributions of equal median, we observe that the mean increases as unequality does. The mean to median ratio will be close to one for perfect equality and larger than one for unequal distributions.
In the following table we can observe the mean to median ratio and its components for the three distributions.
| name | mean | median | ratio |
|---|---|---|---|
| r1 | 9999.235 | 9999.347 | 1.000 |
| r2 | 11130.645 | 9979.472 | 1.115 |
| r3 | 19376.763 | 9911.144 | 1.955 |
We observe that for the first distribution the ratio is around one, while for the last one is closer to two. The larger the mean to median ratio, the more unequal the distribution of income will be.
Gini Index
An alternative measure of inequality is the Gini index. A Gini coefficient of zero reflects a situation of perfect equality where all incomes are equal among individuals. In the other extreme, a Gini coefficient equal to one means that all income is held by a single individual. The Gini coefficient is proportional to Gini index, but scaling from 0 a 100.
The Gini index can be calculated as the relative mean absolute difference between individuals:
\[.\frac{\displaystyle\sum_{i=1}^n \displaystyle\sum_{i=1}^n \vert x_i - x_j \vert}{2n^2\bar{x}} \]
Let’s evaluate the Gini indices of the three distributions:
| r1 | r2 | r3 |
|---|---|---|
| 0.006 | 0.258 | 0.587 |
Gini indices range from near zero for r1 to around 0.6 for r3. This late index would be associated to a quite extreme inequality at the country level.
The Lorenz Curve
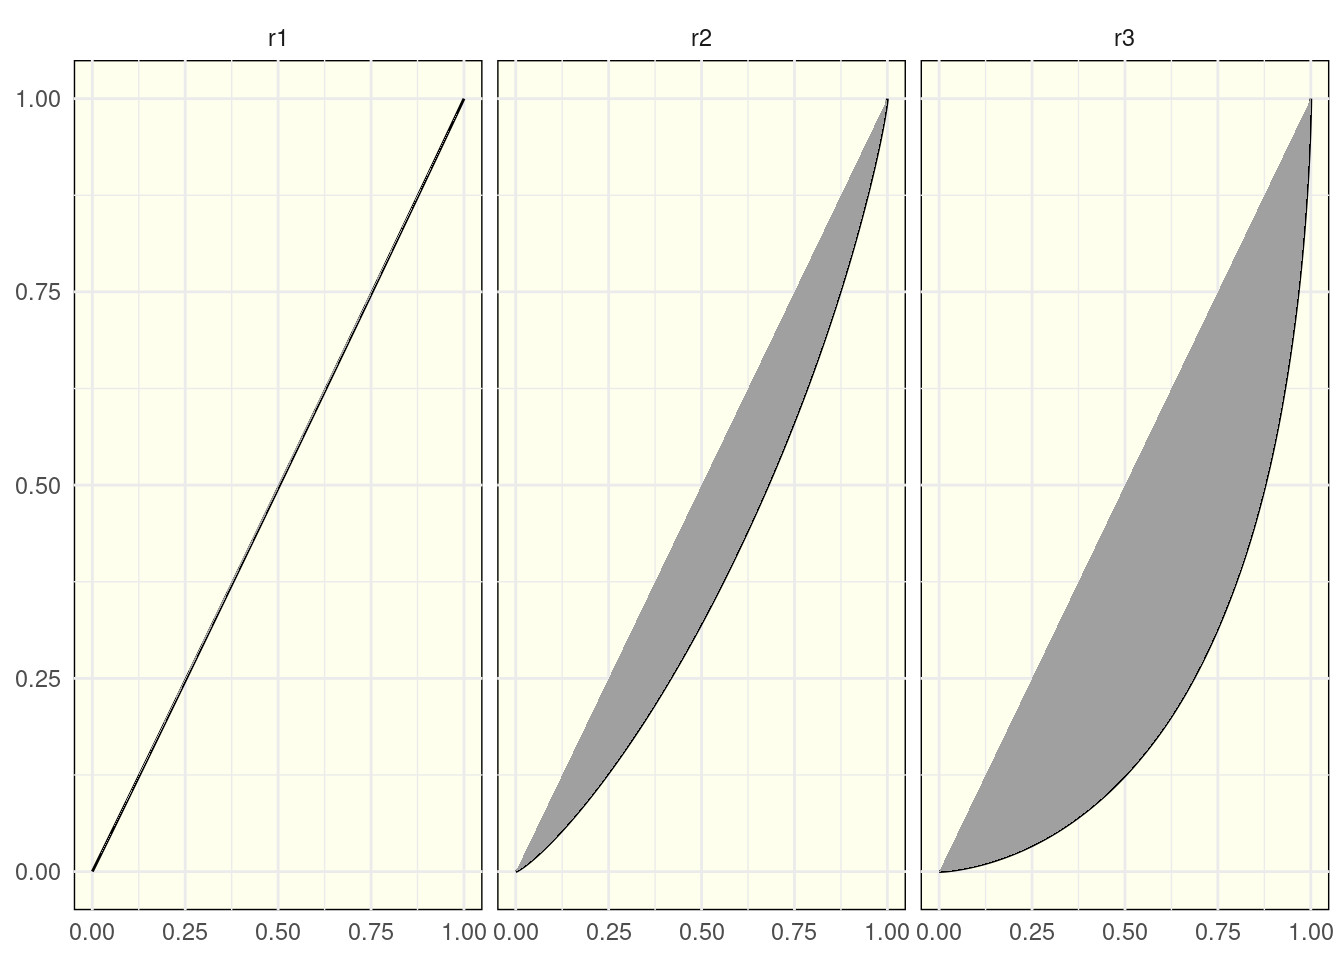
A visual approach to the Gini index is the Lorenz curve. It is the result of representing the cumulative share of people from lower to higher income versus the cumulative share of income earned. The area between the Lorenz curve and the line of perfect equality is equal to half the value of the Gini index.
Let’s see the Lorenz curve for each distribution. The grey area is equal to half the value of the Gini index.
I have introduced three different measures of inequality:
- Mean to median ratio: the higher the mean to median ratio, the more inequality.
- Gini index: the closer to zero, the more equal; the closer to one, the more unequal.
- The more detached is the Lorenz curve from the 45 degrees line of perfect equality, the more unequal the distribution.
More measures of inequality can be found in the Lazovich et al. (2022) paper on inequality in social media.
References
- Lazovich, T., Belli, L., Gonzales, A., Bower, A., Tantipongpipat, U., Lum, K., … & Chowdhury, R. (2022). Measuring disparate outcomes of content recommendation algorithms with distributional inequality metrics. Patterns, 3(8), 100568. https://doi.org/10.1016/j.patter.2022.100568
- Milanovic, B. (2006). Global income inequality: What it is and why it matters. World Bank Policy Research Working Paper, (3865). https://papers.ssrn.com/sol3/papers.cfm?abstract_id=922991
- Wikipedia page of Gini coefficient https://en.wikipedia.org/wiki/Gini_coefficient