Qualitative comparative analysis (QCA) is a data analysis technique that examines the relationships between an outcome and a set of explanatory variables. Unlike other techniques like linear regression, QCA is focused mainly on examining complex combinations of explanatory variables as antecedents of the outcome. Also unlike linear regression and structural equation modelling, QCA is grounded on Boolean algebra, rather than on correlation or covariance structures.
In this post, I will introduce how to define fuzzy memberships in QCA using the QCA package for qualitative comparative analysis. This intends to be the first of a serie of posts about how to perform QCA in R.
I will also use the tidyverse and patchwork for data manipulation and plotting.
library(QCA)
library(tidyverse)
library(patchwork)
The meaning of variables in QCA is different from regression or correlation analysis. A variable in QCA establishes if a case belongs or not to a set. Depending of the type of data we are analyzing, we have two variants of QCA:
- Crisp-set QCA (csQCA), in which variables can only take values of zero (false) and one (true). It can be extended to multi-value variables, thus we have multi-value QCA (mvQCA). In csQCA and mvQCA each case can belong or not to the set defined by each variable.
- Fuzzy-set QCA (fsQCA), where variables have too much values to be treated as multi-value. Fuzzy-set variables represent a degree of membership to a set. They can take any real value from zero (no inclusion) to one (full inclusion).
Obtaining fuzzy memberships with calibration
The calibration of a variable is the process to assign a fuzzy membership score for each case. Fuzzy membership can take values between zero (no membership) and one (full membership). Intermediate values represent the continuum of grades of case’s membership of a set.
Let’s examine how calibration works with the LR dataset of Lipset’s (1959) indicators for the survival of democracy during the inter-war period, included in the QCA package.
head(LR)## DEV URB LIT IND STB SURV
## AU 720 33.4 98.0 33.4 10 -9
## BE 1098 60.5 94.4 48.9 4 10
## CZ 586 69.0 95.9 37.4 6 7
## EE 468 28.5 95.0 14.0 6 -6
## FI 590 22.0 99.1 22.0 9 4
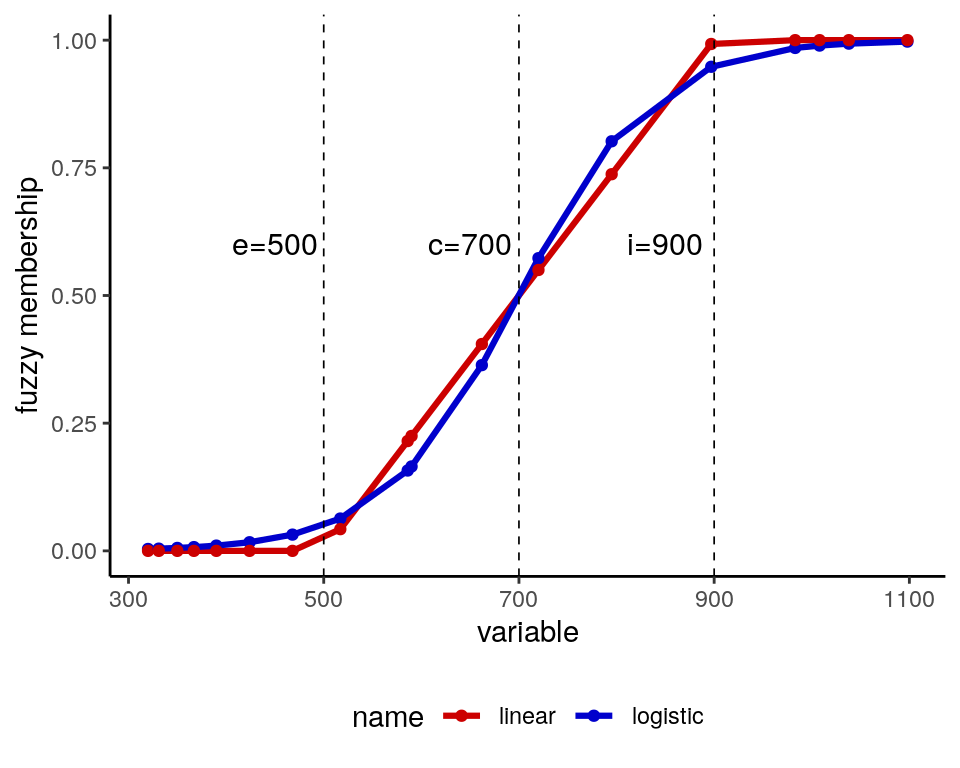
## FR 983 21.2 96.2 34.8 5 10Calibrating LR consists of assigning a fuzzy membership to each case for each of the six variables. In this case, variables are monotonous. For instance, high values of DEV represent a high value of development, so cases with high values of DEV will tend to belong to the set of highly-developed countries. For these kind of variables we will define a S-shaped calibration using three parameters:
e: the threshold for non-membership or exclusione,c: the crossover pointc,i: the threshold for full membership or inclusioni.
These values are crucial to replicate a fsQCA analysis, so it is important to report the calibration method and the values of calibration parameteres.
The calibrate function of QCA package allows logistic and linear S-shaped calibration by setting the logistic parameter to TRUE or FALSE, respectively. Let’s calibrate the DEV variable in both ways:
dev <- LR %>%
  select(DEV) %>%
  mutate(logistic = calibrate(DEV, type = "fuzzy", thresholds = "e=500, c=700, i=900", logistic=TRUE),
         linear = calibrate(DEV, ype = "fuzzy", thresholds = "e=500, c=700, i=900", logistic=FALSE))
Let’s plot the calibration results to see the difference between the two methods, and the role of e, c and i parameters:
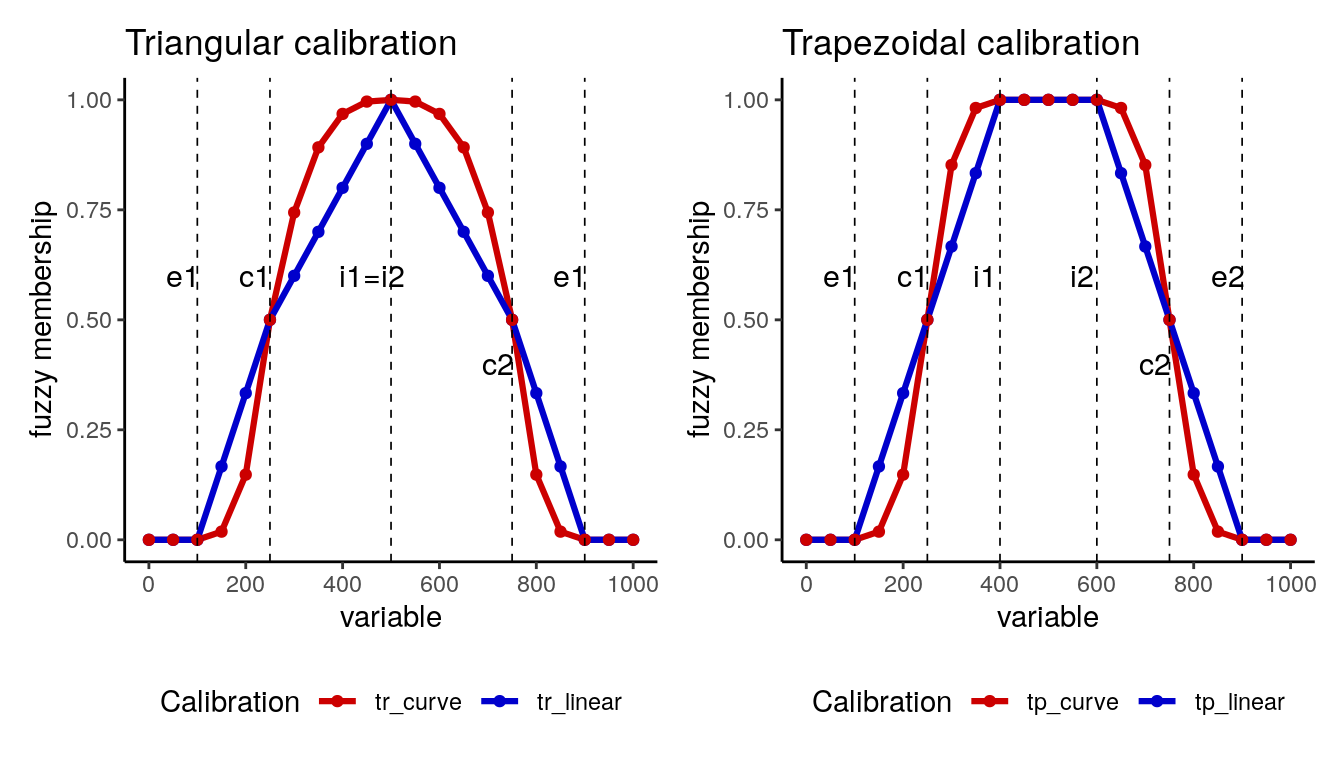
In some ocassions, it might happen that full membership to a set is associated with intermediate values of the variable. This would be the case if we wanted to define a set of mid-developed countries from DEV. To do this we need to calibrate variables using a bell-shaped curve. For these functions, we need to define in calibrate the parameters e1, c1, i1 for the left-hand side of the bell, and e2, c2, i2 for the right-hand side. The below and above parameters allow a non-linear fit when assigning membership scores. Let’s see some examples with artificial data going from zero to 1000. I am defining a triangular calibration making i1 equal to i2, and a trapezoidal calibration making both variables different.
bell_test <- data.frame(X = seq(0, 1000, 50)) %>%
  mutate(tr_linear = calibrate(X, thresholds = "e1=100, c1=250, i1=500, i2=500, c2=750, e2=900"),
         tr_curve = calibrate(X, thresholds = "e1=100, c1=250, i1=500, i2=500, c2=750, e2=900", below = 3, above = 3),
         tp_linear = calibrate(X, thresholds = "e1=100, c1=250, i1=400, i2=600, c2=750, e2=900"),
         tp_curve = calibrate(X, thresholds = "e1=100, c1=250, i1=400, i2=600, c2=750, e2=900", below = 3, above = 3))
The following plot shows how each calibration works:
The QCA package provides LF, a version of the Lipset dataset calibrated to fuzzy sets:
head(LF)## DEV URB LIT IND STB SURV
## AU 0.81 0.12 0.99 0.73 0.43 0.05
## BE 0.99 0.89 0.98 1.00 0.98 0.95
## CZ 0.58 0.98 0.98 0.90 0.91 0.89
## EE 0.16 0.07 0.98 0.01 0.91 0.12
## FI 0.58 0.03 0.99 0.08 0.58 0.77
## FR 0.98 0.03 0.99 0.81 0.95 0.95An important thing to consider is that you should avoid getting calibration values of exactly 0.5, as these will be problematic in further steps of the analysis.
Boolean algebra with fuzzy memberships
The QCA package provides LF, a version of the Lipset dataset calibrated to fuzzy sets:
head(LF)## DEV URB LIT IND STB SURV
## AU 0.81 0.12 0.99 0.73 0.43 0.05
## BE 0.99 0.89 0.98 1.00 0.98 0.95
## CZ 0.58 0.98 0.98 0.90 0.91 0.89
## EE 0.16 0.07 0.98 0.01 0.91 0.12
## FI 0.58 0.03 0.99 0.08 0.58 0.77
## FR 0.98 0.03 0.99 0.81 0.95 0.95In QCA we can examine relationships between an outcome and complex relationships between antecedents. In the Lipset dataset, we can explore the relationship between the outcome survival of democracy SURV and level of development DEV, but we also can explore the relationship between the outcome and variable level of development and literacy DEV*LIT. We can do that defining a Boolean algebra for fuzzy sets:
- Set intersection or AND operator: \(A*B = min\left(A,B\right)\).
- Set union or OR operator: \(A+B = max\left(A,B\right)\).
- Set negation or NOT operator: \(\sim A = 1-A\).
The result of a complex logical operation like \(DEV*URB + LIT*\sim IND\) returns a fuzzy membership score, similar to the ones obtained from calibration of the original explanatory variables. We can use the compute function from the admisc package (loaded when calling QCA) to obtain fuzzy memberships for relationships written as sum of products, where the product stands for logical AND / set intersection, and the sum for logical OR / set union (we need to write admisc::compute to differentiate the function from the compute function of dplyr).
admisc::compute("DEV*URB + LIT*~IND", data = LF)## [1] 0.27 0.89 0.58 0.98 0.92 0.19 0.79 0.13 0.88 0.98 0.41 0.98 0.59 0.01 0.17
## [16] 0.09 0.33 0.98Fuzzy sets and qualitative comparative analysis
Zadeh (1965) defined fuzzy sets as objects with continuum of grades of membership. Rather than belonging or not to a set, the membership of an object is defined by a continuous function between zero and one. We can define a Boolean algebra for fuzzy sets with AND, OR and NOT operations, based on intersection, union and negation of sets. Among many other applications, fuzzy sets and fuzzy logic allow aplying qualitative comparative analysis to continuous variables.
Bibliography and resources
- Dușa, Adrian (2021). QCA with R: A Comprehensive Resource. https://bookdown.org/dusadrian/QCAbook/
- Lipset, S. M. (1959). Some Social Requisites of Democracy: Economic Development and Political Legitimacy. American Political Science Review, 53:69-105.
- Zadeh, L. A. (1965). Fuzzy Sets. Information and Control 8:338–53.
Built with R 4.1.1, patchwork 1.1.1, QCA 3.12 and tidyverse 1.3.1