In the previous post, I reported the contributions by country to the 2025 edition of the International Conference for Learning Representations (ICLR). ICLR is one of the world’s premier artificial intelligence and machine learning conferences, focused on representation learning, the study of how computers can automatically learn meaningful and useful representations of data to solve complex tasks. The posts of this series are motivated by the work of Dmytro Lopushanskyy exploring affiliations of the 2025 edition of ICLR.
While the advance of scientific research calls for international collaboration, it can be hindered by the strategic competition between countries to develop the best AI models. To examine the extent to which international collaboration in learning representations is fostered or hindered, in this post I will present a preliminary analysis of the patterns of international collaboration present of the contributions presented in ICLR 2025.
The Network of Scientific Collaboration
To examine between-country collaboration, I will be using the distinct article-country pairs of the conference, obtained from the records of the main conference papers registered in Scopus. Each article is represented by its Scopus eid, and each country by its iso3c code.
## # A tibble: 780 × 2
##    eid                 iso3c
##    <chr>               <chr>
##  1 2-s2.0-105010206394 CHN
##  2 2-s2.0-105010206394 HKG
##  3 2-s2.0-85143254100  CHN
##  4 2-s2.0-85199920132  CHN
##  5 2-s2.0-105010187547 DEU
##  6 2-s2.0-85200551272  CHN
##  7 2-s2.0-85200551272  HKG
##  8 2-s2.0-85200551272  USA
##  9 2-s2.0-105010222873 CHE
## 10 2-s2.0-105010222873 DEU
## # ℹ 770 more rows
The table above reports 780 article-country pairs, involving 504 articles and 29 countries. Those data allow building the article country network. It is a bipartite, undirected and unweighted network where each article is connected with the countries of its authors. This network can be described with a binary matrix \(B_{ac}\) with as many rows as articles and as many columns of involved countries.
From this bipartite graph, we can obtain the country collaboration network. It is an undirected, weighted network with weights \(w_{ij}\) equal to the number of papers with authors from countries \(i\) and \(j\). The weights matrix \(W\) can be obtained from the article-country network as:
\[ W = B^TB \]
For 2025 the country collaboration network has 29 node and 112 edges.
For weighted networks, we have two indicators of centrality:
- Node strength is the analogous to node degree for weighted networks, and it is equal to the sum of weights arriving or departing from a node.
- Weighted node betweenness is an indicator of the role of a country as an intermediary between two non-connected countries. In graphs where weight is a proxy for intensity of collaboration, the inverse of weight is used to calculate weighted node betweenness.
Here is a listing of countries ordered by value of strength:
| name | strength | btw |
|---|---|---|
| USA | 172 | 338.5 |
| CHN | 109 | 100.5 |
| GBR | 83 | 30.0 |
| CAN | 58 | 26.0 |
| DEU | 45 | 25.0 |
| HKG | 35 | 0.0 |
| CHE | 34 | 0.0 |
| AUS | 32 | 0.0 |
| SGP | 21 | 0.0 |
| ITA | 20 | 0.0 |
| JPN | 17 | 0.0 |
| ARE | 14 | 0.0 |
| DNK | 14 | 0.0 |
| FRA | 14 | 0.0 |
| KOR | 10 | 0.0 |
| NLD | 10 | 0.0 |
| SAU | 8 | 0.0 |
| BEL | 7 | 0.0 |
| ESP | 7 | 0.0 |
| FIN | 5 | 0.0 |
| ISR | 5 | 0.0 |
| SWE | 5 | 0.0 |
| IND | 4 | 0.0 |
| POL | 4 | 0.0 |
| AUT | 3 | 0.0 |
| RUS | 3 | 0.0 |
| NOR | 3 | 0.0 |
| CZE | 2 | 0.0 |
| MAC | 2 | 0.0 |
For this graph, there is a strong relationship between strength and betweenness: the countries with higher strength are the ones with highest betweenness. The United States (USA) and China (CHN) appear as the countries with most collaborations, followed by Great Britain (GBR), Canada (CAN) and Germany (DEU). Unsurprisingly, the countries with most contributions are the ones with more collaborations with other countries.
As for specific edge weights, they can be appreciated in the following graph.
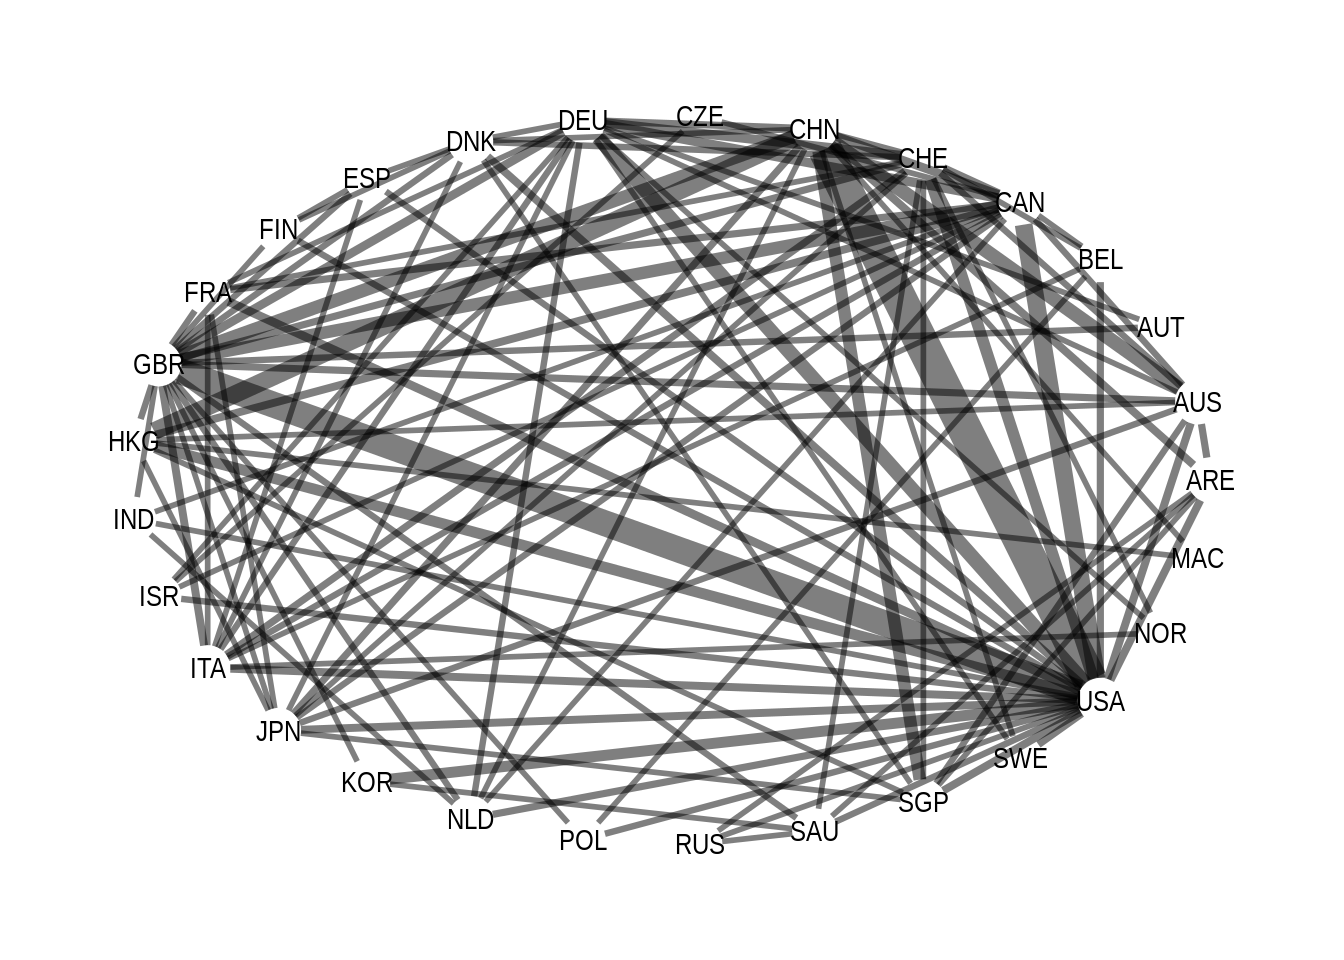
This graph shows that the most intense collaborations are between USA and China and with USA and GBR.
Comparison with a Null Model
The above result apparently presents preliminary evidence that the two main players in the AI competition, China and USA, pursue a strong collaboration in the development of AI-related scientific research. Nevertheless, this result must be taken with caution. As China and USA are countries producing more articles, it is quite likely that a paper can have Chinese and American co-authors.
To elucidate if this volume of collaboration represents an intention to pursue joint collaborations or an statistical artifact, I have compared the edge weights with the weights of a collection of networks obtained with a null model, a randomized version of the network that preserves structural features but removes the specific patterns present in the real-world network.
The null model is based on the article-country network. I have used the Curveball algorithm (Strona et al., 2014) to create an article-country randomized matrix \(B_{rand}\) that preserves the sums of rows and columns of \(B_{ac}\). This means that in the randomized network the number of countries of authors of each article (sums of rows) and number of articles of each country (sums of columns) is preserved. Once obtained the author-country network, I obtain the country collaboration network using the identity \(W_{rand} = B^T_{rand}B_{rand}\)
Using this framework, I have created 1,000 instances of the null model. I have used these instances to bootstrap the distribution of edge weight in the null model, and to test the null hypothesis that observed edge weight is equal to the population mean of the corresponding weight of the null model.
To illustrate this, in the following figure I present the histogram of weights of the China-USA edge in the null model, together with the observed edge weight.
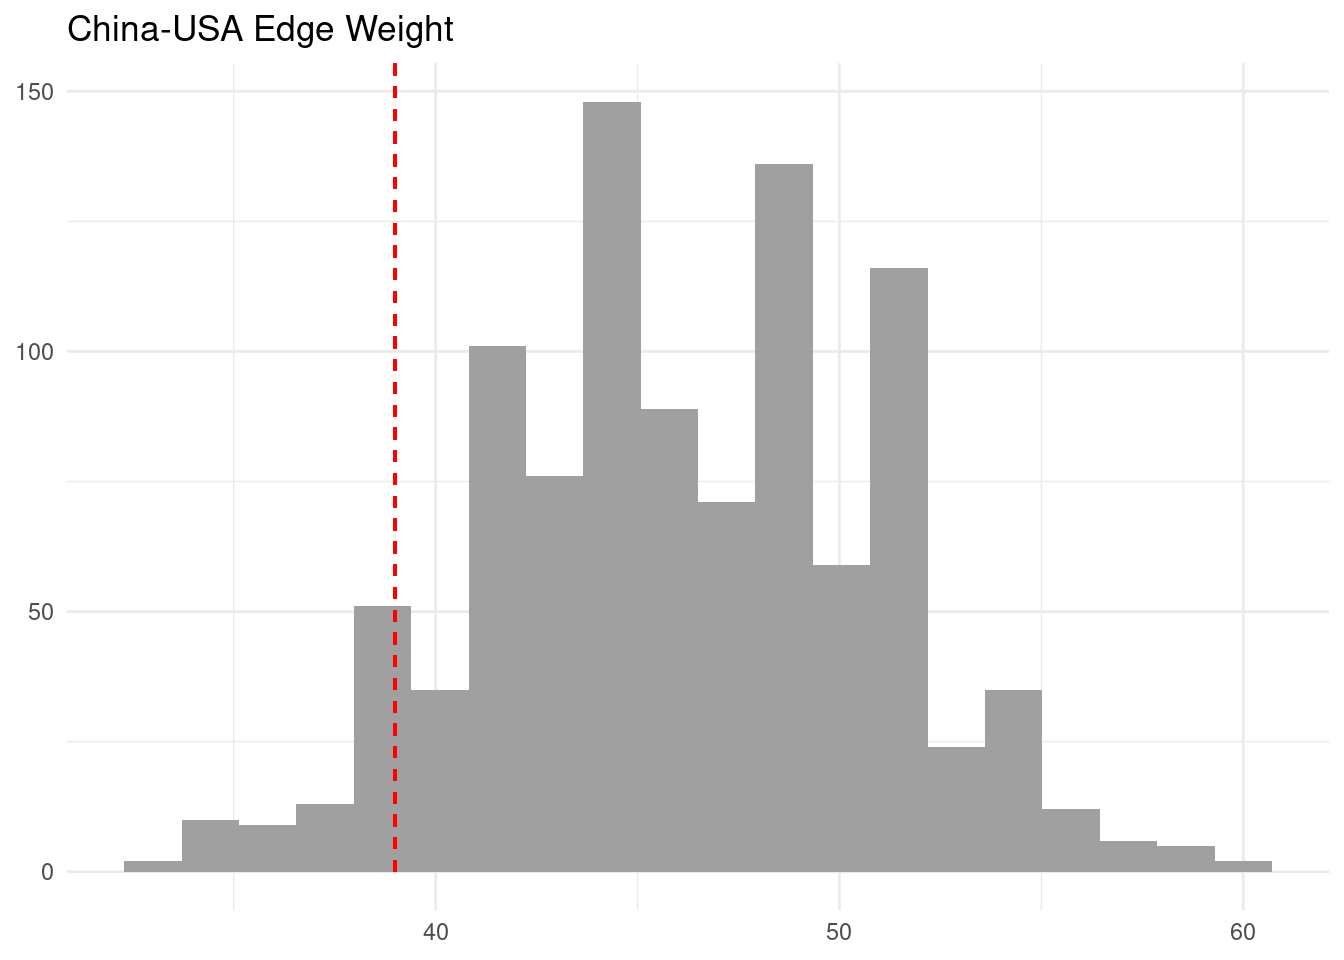
The distribution of the edge weight in the null model is approximately normal, and the observed value is in the lower tail of the distribution. The t-test of the null hypothesis that the mean of the null model is equal to the observed edge weight has the following result:
##
## 	One Sample t-test
##
## data:  china_usa
## t = 47.529, df = 999, p-value < 2.2e-16
## alternative hypothesis: true mean is not equal to 39
## 95 percent confidence interval:
##  45.87781 46.47019
## sample estimates:
## mean of x
##    46.174
From this evidence, we can confirm that the level of collaboration between China and USA is below the expected if country collaborations were chosen randomly, in spite of its large absolute value. This fact provides preliminary support to the hypothesis that USA and China are constraining mutual collaboration in AI-related research.
I have extended this analysis to the rest of edge weights, obtaining the t-value and the effect sizes for each of the edge weights. Values of \(|t| > 1.95\) show statistical significance, whil statistical relevance is measured by effect size. Values of effect size \(|z| \in [0.5, 0.8]\) are considered moderate, and values \(|z| > 0.8\) show evidence of a large effect size.
Here are the results for edges with observed weights equal or larger than five. A positive effect size represents a intensity of collaboration smaller than expected by chance: the expected mean weight is larger than the observed weight. A negative effect size, on the contrary, shows a intensity of collaboration larger than expected.
| c_org | c_dst | org | dst | mean_null | sd_null | obs_weight | t_value | z |
|---|---|---|---|---|---|---|---|---|
| USA | CHN | 4 | 1 | 46.174 | 4.773 | 39 | 47.529 | 1.503 |
| GBR | USA | 6 | 4 | 24.360 | 3.776 | 28 | -30.481 | -0.964 |
| HKG | CHN | 2 | 1 | 5.086 | 2.029 | 17 | -185.642 | -5.871 |
| CAN | USA | 7 | 4 | 17.472 | 3.265 | 17 | 4.571 | 0.145 |
| USA | DEU | 4 | 3 | 15.314 | 2.987 | 13 | 24.498 | 0.775 |
| AUS | CHN | 8 | 1 | 4.058 | 1.834 | 12 | -136.972 | -4.331 |
| GBR | CHN | 6 | 1 | 13.580 | 3.099 | 11 | 26.330 | 0.833 |
| CAN | GBR | 7 | 6 | 5.307 | 2.106 | 10 | -70.484 | -2.229 |
| SGP | CHN | 12 | 1 | 3.145 | 1.533 | 10 | -141.398 | -4.471 |
| CHE | USA | 5 | 4 | 9.726 | 2.359 | 9 | 9.731 | 0.308 |
| USA | HKG | 4 | 2 | 8.803 | 2.314 | 8 | 10.973 | 0.347 |
| KOR | USA | 10 | 4 | 5.748 | 1.851 | 8 | -38.475 | -1.217 |
| CHE | DEU | 5 | 3 | 1.873 | 1.245 | 6 | -104.812 | -3.314 |
| CAN | DEU | 7 | 3 | 3.434 | 1.743 | 6 | -46.549 | -1.472 |
| GBR | DEU | 6 | 3 | 4.653 | 1.958 | 5 | -5.605 | -0.177 |
| CAN | CHN | 7 | 1 | 9.795 | 2.757 | 5 | 55.000 | 1.739 |
| FRA | USA | 13 | 4 | 7.788 | 2.257 | 5 | 39.070 | 1.235 |
USA and China are the two countries with largest contributions to the conference, so it is not strange that many of the edges involve any of these two countries. To examine the collaborations of USA, I have filtered the edge weights significantly different from the null model, with an absolute value of effect size equal or larger than 0.8.
| c_org | c_dst | org | dst | mean_null | sd_null | obs_weight | t_value | z |
|---|---|---|---|---|---|---|---|---|
| USA | CHN | 4 | 1 | 46.174 | 4.773 | 39 | 47.529 | 1.503 |
| GBR | USA | 6 | 4 | 24.360 | 3.776 | 28 | -30.481 | -0.964 |
| KOR | USA | 10 | 4 | 5.748 | 1.851 | 8 | -38.475 | -1.217 |
| FRA | USA | 13 | 4 | 7.788 | 2.257 | 5 | 39.070 | 1.235 |
The only countries with a strong relationship with USA regarding AI research are the United Kingdom and Korea. It is noteworthy that USA constrains collaboration not only with China, but also with a potential ally such as France.
| c_org | c_dst | org | dst | mean_null | sd_null | obs_weight | t_value | z |
|---|---|---|---|---|---|---|---|---|
| USA | CHN | 4 | 1 | 46.174 | 4.773 | 39 | 47.529 | 1.503 |
| HKG | CHN | 2 | 1 | 5.086 | 2.029 | 17 | -185.642 | -5.871 |
| AUS | CHN | 8 | 1 | 4.058 | 1.834 | 12 | -136.972 | -4.331 |
| GBR | CHN | 6 | 1 | 13.580 | 3.099 | 11 | 26.330 | 0.833 |
| SGP | CHN | 12 | 1 | 3.145 | 1.533 | 10 | -141.398 | -4.471 |
| CAN | CHN | 7 | 1 | 9.795 | 2.757 | 5 | 55.000 | 1.739 |
The countries with a strong collaboration pattern with China are Hong Kong, Singapore and Australia. The presence of Australia in this list can be surprising, but we must take into account Australia’s large population of Chinese-origin researchers and doctoral students, and the intense collaboration between Australian and Chinese academic institutions. On the other hand, the levels of scientific collaboration of China with USA, Great Britain and Canada are smaller than expected by their volume of contributions.
Conclusions
The analysis of patterns of collaboration drawn from conference papers presented at the 2025 ICLR Conference shows that the competition in the AI industry has been transferred to the academic community of AI research. USA and China, the two countries with the largest communities in AI, restrain their collaboration to values lower than expected if country collaborations were selected randomly. USA collaborates with Great Britain and Korea, and China with Hong Kong, Singapore and Australia. This pattern of scientific collaboration mimicks political and economic blocks in the present multi-polar world order, with the exception of Australia. Although Australia is aligned with USA and NATO countries, the large volume of Chinese scientists in Australian universities strengthens their academic relationship with China.
This study presents preliminary evidences, and must be extended in the scope of scientific collaborations, including conferences and journal papers. A longitudinal research can also be useful, as it could allow to examine how patterns of collaboration between countries evolve along time.
References
- Strona, G., Nappo, D., Boccacci, F., Fattorini, S., & San-Miguel-Ayanz, J. (2014). A fast and unbiased procedure to randomize ecological binary matrices with fixed row and column totals. Nature Communications, 5, 4114. https://doi.org/10.1038/ncomms5114.